Product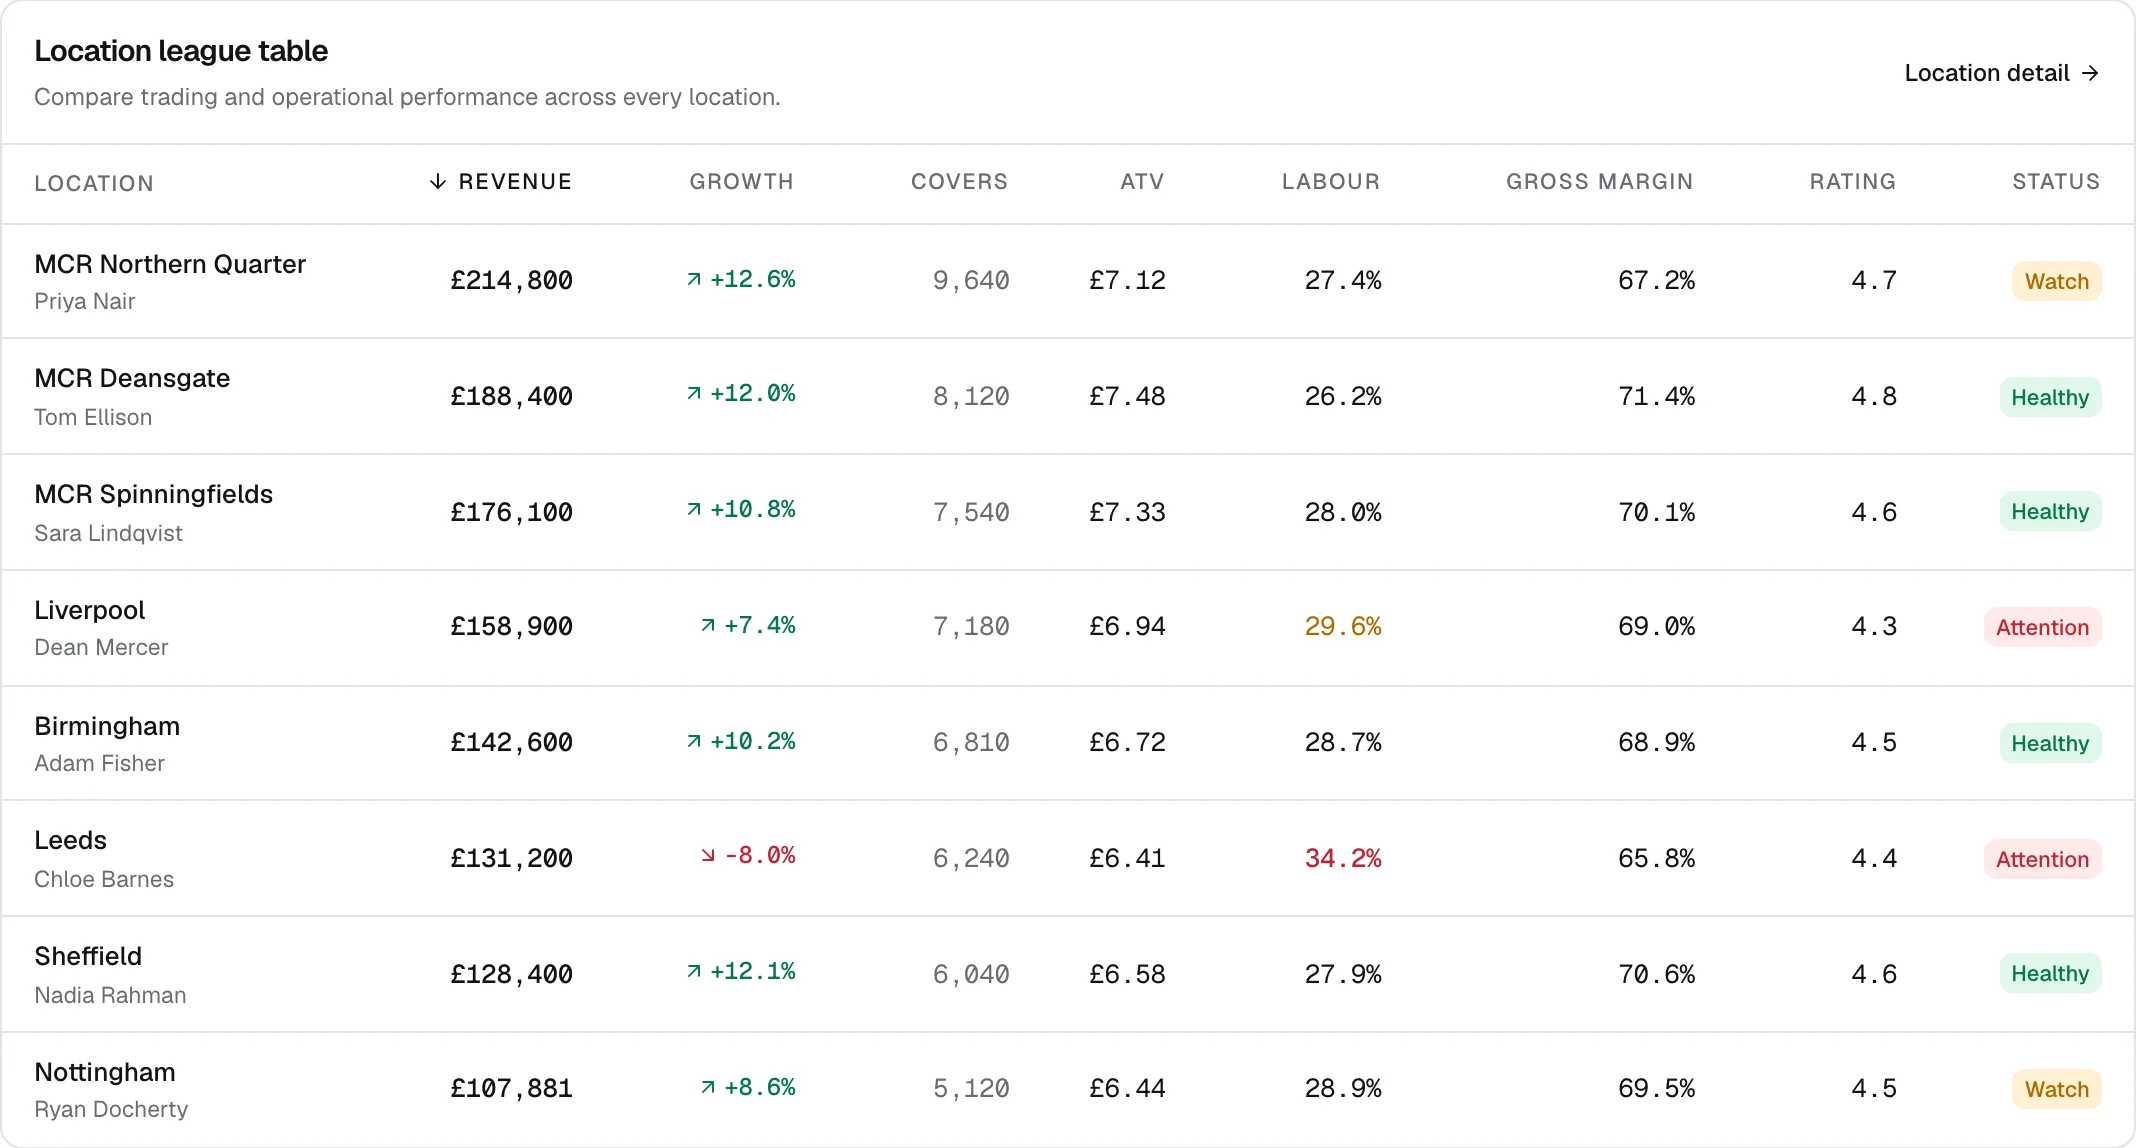
Shown with demonstration data.
Compare your sites · Saves money
Every site measured the same way
Sales, labour, margin and reviews for every site side by side, on the same terms. See which sites are leading, which are drifting, and what the best ones are doing differently.
What you get
What it does for you
A fair league table
Every site calculated the same way, so you compare performance, not differences in how people report.
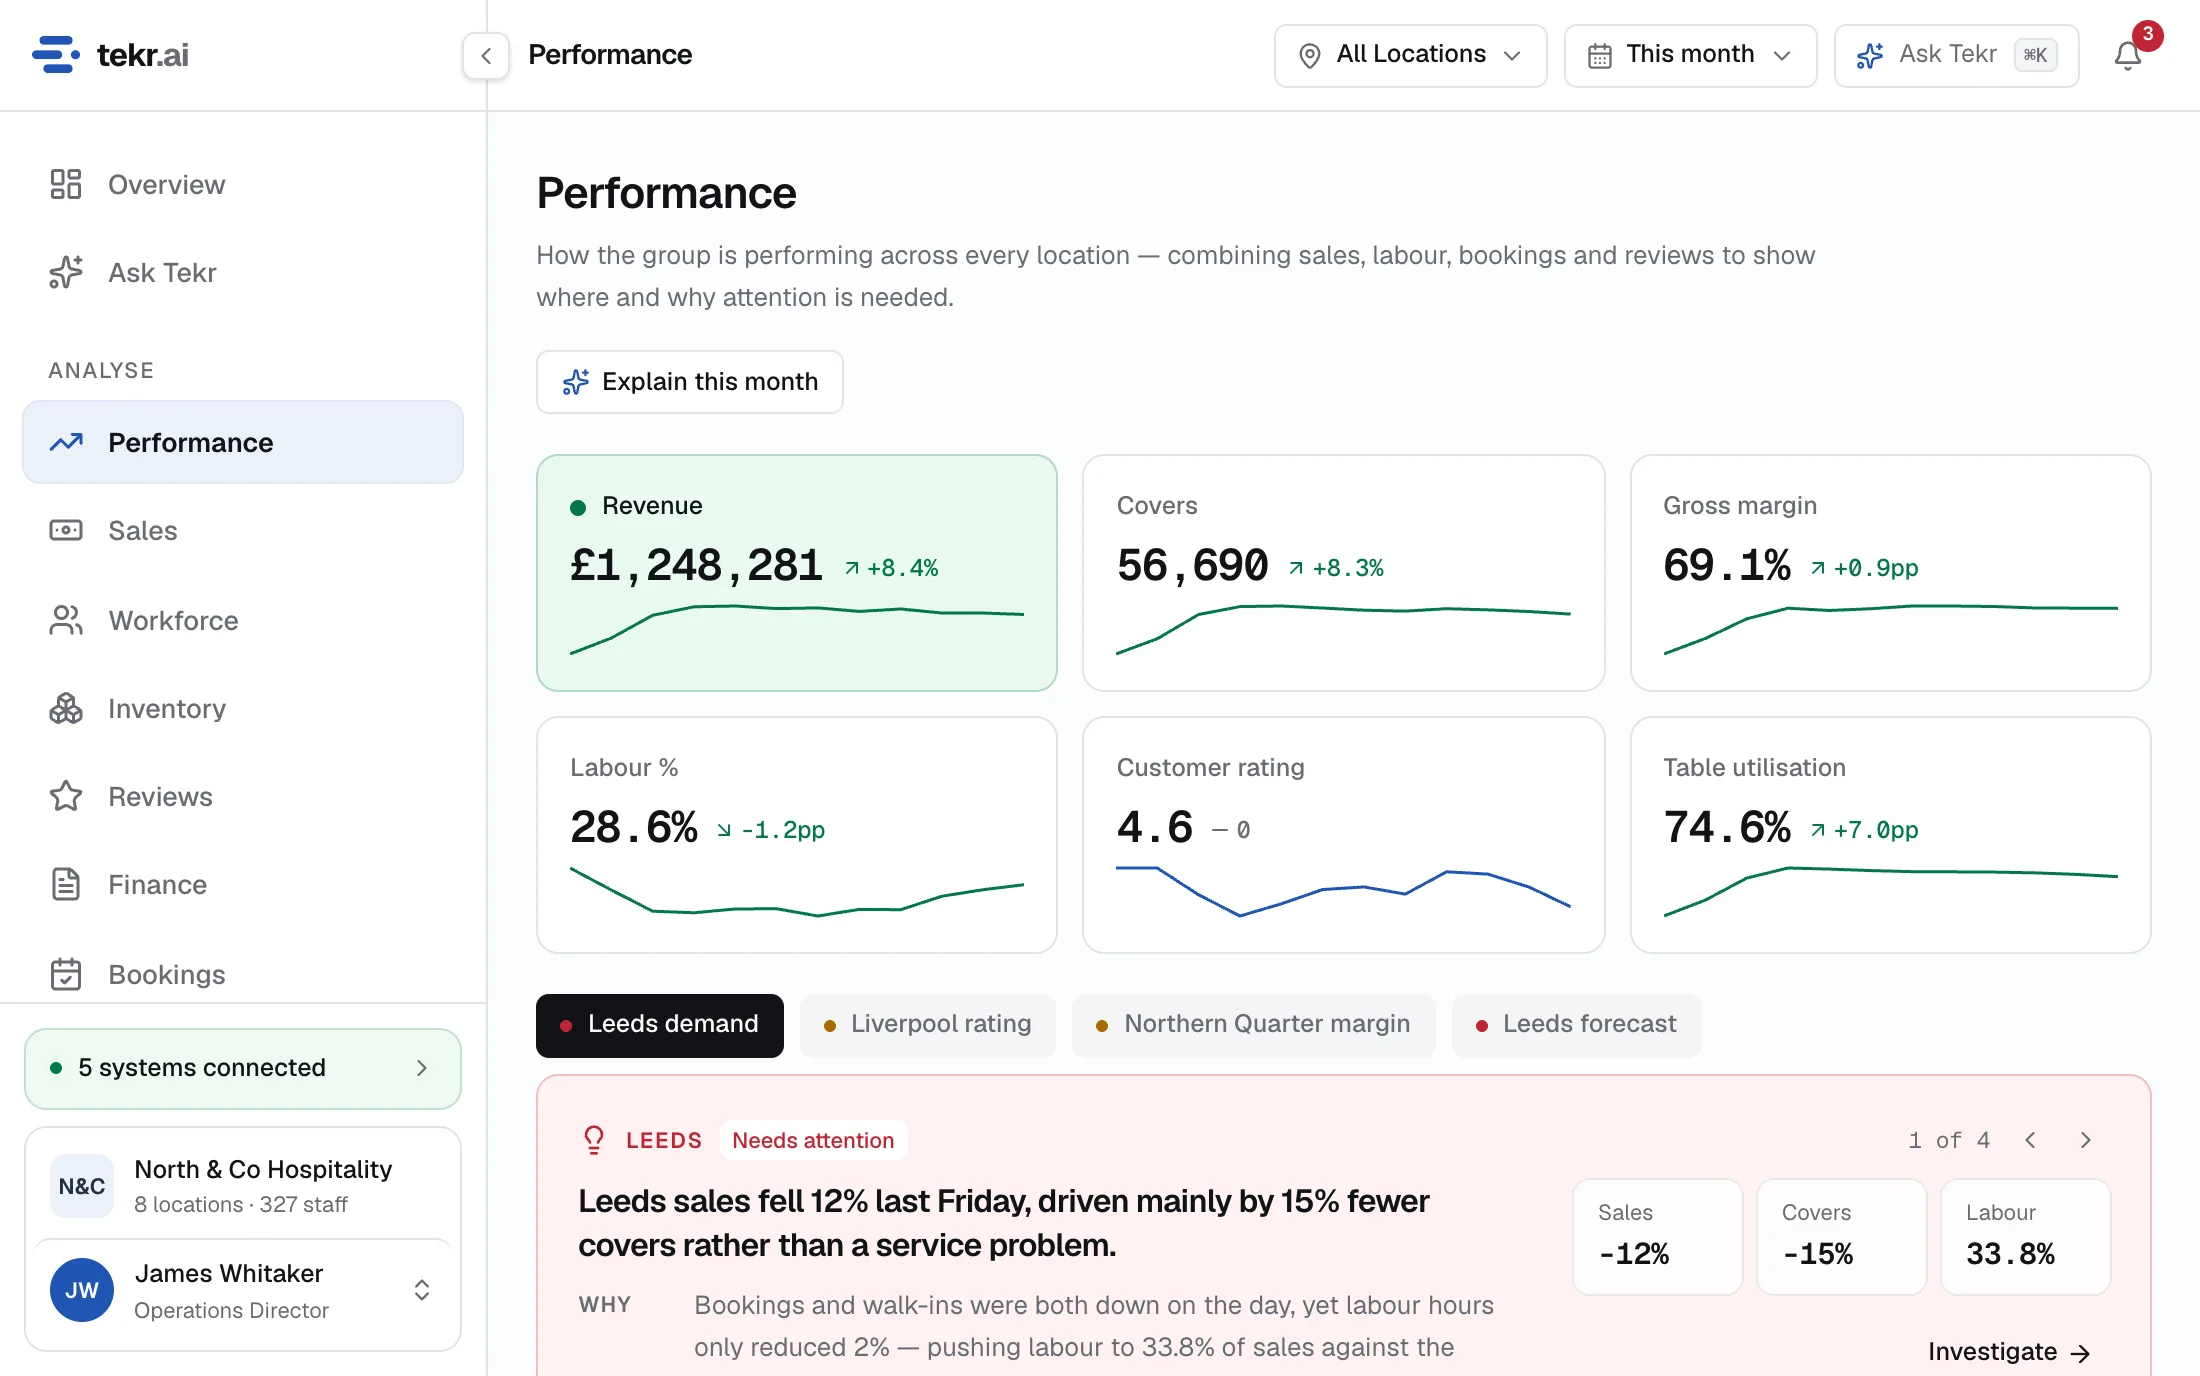
Spot the drift early
Each site is judged against its own trend too, so a slow decline shows long before month end.
Group the way you run it
Look at all sites, a region, or a hand-picked set, and switch between them in a click.
Each manager sees their own
General managers see their site; you see the whole group.
Against forecast and last year
Every site against plan and the same period last year, with the gaps explained.
- Revenue, margin and labour trends
- Actual against forecast
- Site-by-site reports in seconds

See it working on a demonstration group
We’ll walk you through Tekr and talk about the systems you use today.